
Blog Post
Simplifying Network Design with an Intuitive Data Model
With many choices of how to design your network, what makes AIMMS SC Navigator stand out? We believe it’s the easiest to pick up for supply chain professionals but what makes it easy to use?
There are 4 elements to consider here:
- Intuitive data model
- Control panel for quick scenario creation
- Easy error support
- Preconfigured results visualization.
Let’s dive into each element in detail.
1. Data Model
SC Navigator’s data model is designed around supply chain concepts, not mathematical concepts. As a company, AIMMS has a deep understanding of mathematics, but we don’t think you should have to.
Our data model is designed around supply chain entities you will recognize, like customers, warehouses, suppliers, production, and transport lanes. It is designed around having the data in the place you would most expect to see it. Everything to do with warehouses can be found in the Warehouse tabs. That includes all costs (fixed, semi-fixed, or variable), capacities, restrictions on the number of warehouses, or the way they open and close.
We also offer flexibility without adding complexity. Instead of adding long lists of possible objectives to optimize, we allow you to define your own freely. Instead of defining long lists of unit conversions for you, we allow you to define your own. And if you don’t need that flexibility, you never need to even know about it. We’re committed to helping you understand the data model.
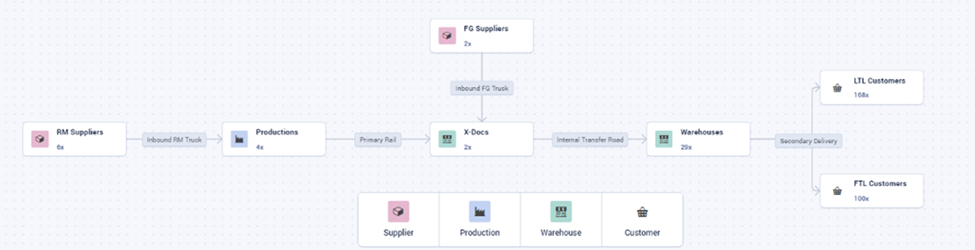
When you’re first starting out, you can configure your supply chain visually using our Whiteboard, before you even look at any data tables. After that, you can work with the data in our friendly, easy-to-use Excel template, which comes complete with color coding to help you understand what to fill in. Explanations of the data are embedded in the Excel template, right where you need them. And if you’re ready for a more automated and repeatable experience, our teams can help you configure direct integration between your systems and our Azure Data Lake Storage supporting SC Navigator.
2. Quick Scenario Creation
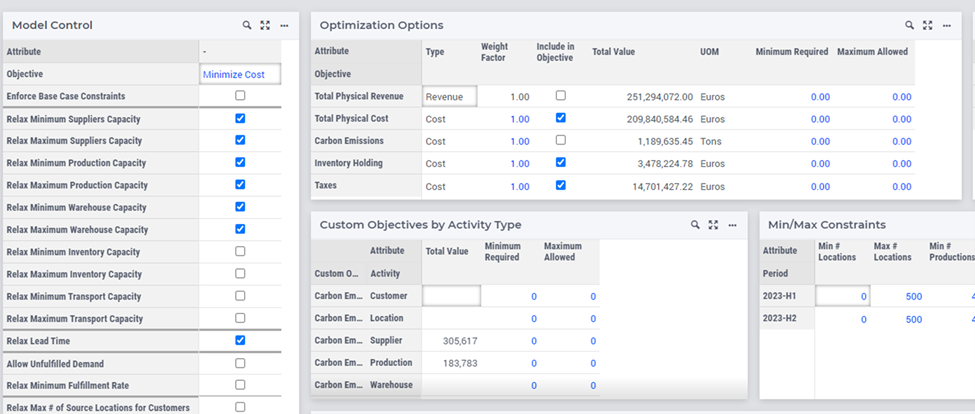
We’re trying to make the supply chain network design process quick, seamless, and easy for the typical user. So, we’ve distilled years of experience of what the network design process usually looks like into our Control Panel. It’s a one-stop shop for the most common types of scenarios that everyone does.
If you want to expand warehouses, open more warehouses, or reduce to fewer, those are all accessible with just a couple of clicks. You can quickly switch between optimizing for cost, profit, service, or sustainability. If your process includes things like historical baseline and quick wins, then true blank-slate optimization, those are easy to set up. You can do more unusual or precise scenarios too, but the control panel takes the work out of the first set of model runs.
3. Easy Error Support
Even with the most intuitive data model and user interface, everyone makes mistakes sometimes.
SC Navigator makes it easy to find and fix those errors. Our data validation functionality checks all datasets uploaded and provides clear explanations of any errors it finds. Or if you accidentally create an impossible situation in one of your scenarios our infeasibility analysis helps you find why it’s impossible and ask a better question. Infeasibility analysis is fully flexible, so you ask it to concentrate on the supply chain area you’re most interested in – this can give the most useful answers.
4. Preconfigured Results Visualization
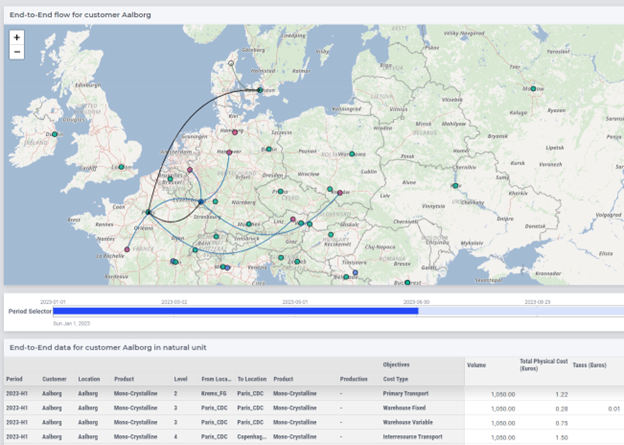
When you run a scenario, we want to make it as easy as possible to understand the results. This is why we have configured dashboards on all the key supply chain areas so that you can view your results as tables, graphs, and maps without lifting a finger.
This includes reporting on each individual supply chain area (customers, warehouses, suppliers, production, and transport lanes) but also a comprehensive end-to-end report that gives details of all those elements along the whole path to serve the customer. The end-to-end report can show the path to serve just one customer, the path from one supplier, or the end-to-end usage of any site or group of sites. Each dashboard provides data in tables for the details and in graphs and maps for visual impact.
It’s also possible to integrate with popular BI tools if you want to customize and present in your company’s style, but we want to give you understanding without you having to make that effort.
Want to see how SC Navigator simplifies use, empowers scenario modeling, and enhances decision-making within your organization? Watch our detailed demo.
Final Words
In conclusion, AIMMS SC Navigator stands out as a powerful, yet user-friendly tool designed to simplify the complexities of supply chain network design.
With an intuitive data model tailored to supply chain concepts, a streamlined control panel for quick scenario creation, robust error support, and preconfigured visualizations, it empowers supply chain professionals to make informed decisions with ease.
By focusing on usability without sacrificing flexibility, SC Navigator ensures that even the most complex supply chain challenges can be tackled efficiently, enabling you to focus on optimizing your operations and achieving your business goals.
Ready to optimize your network design? Talk to our experts today!