Supply Chain Segmentation (SCS) – Can it make a difference?
This post was written by Dr. Gerhard Plenert, author of Supply Chain Optimization through Segmentation and Analytics.
BACKGROUND
 We tend to get ourselves locked into a one-size-fits-all solution mentality. We solve a problem and because a particular solution worked for us we automatically replicate that solution by attempting to apply it to every problem we encounter. We talk a lot about “out of the box” thinking, but we feel more secure by staying inside our solution box.
The one-size-fits-all dilemma also applies to solving Supply Chain problems. For example, if a particular planning solution works effectively for one product line or customer or supplier, then it must also be the best solution for all product lines. And we apply this solution across the board. Then we stand back and wonder why it didn’t work when we knew for sure that it had worked well in the past.
Let’s take a look at the problems we have with a standardized solution at a high level. To start with, within a supply chain, in simplistic terms, we commonly have three perspectives:
- The inbound, supplier side perspective
- The internal, manufacturing perspective
- The outbound, demand / customer perspective
Each of these perspectives deal with common constraints, like planning, scheduling, inventory optimization, quality, efficiency, etc. How do we optimize these constraints?
SEGMENTATION
 Recently a large amount of attention is being paid to a tool call Segmentation. Let’s start with a definition. Segmentation is a tool which differentiates our area of interest, like products or customers, and then groups items in this area into clusters with a common set of characteristics.
Segmentation looks for common characteristics. This diagram shows 6 possible ways to break down and define these characteristics. When segmenting you would need to identify which of these characteristic sets works best when we are trying to achieve your specific goals. Once we have the groupings defined, then we need to search out what the optimizing tools or methodologies will be for each of the groupings.
SCS utilizes a three pronged approach to optimizing Return on Availability: 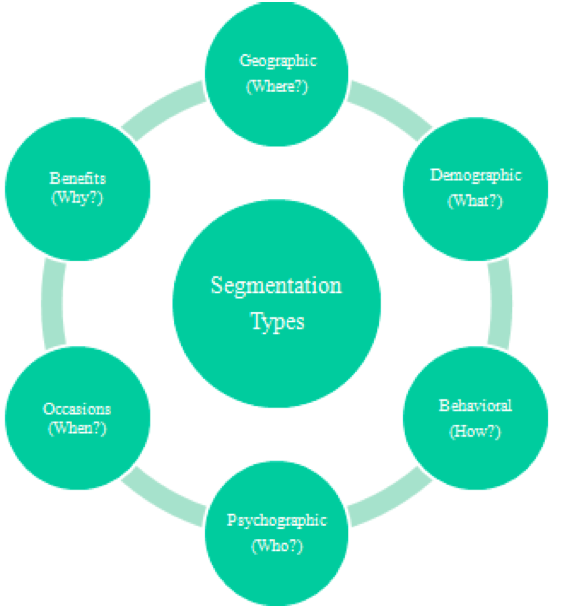
(A) Product Lifecycle
(B) Reduced Cost
(C) Increased Benefits
The diagram shows some of the characteristics of each of these prongs.
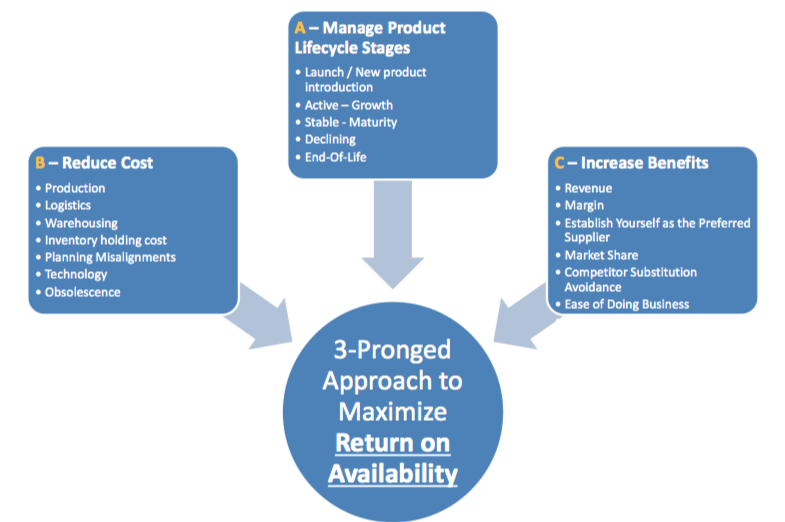
Each prong is analyzed for its validity and application. How important are each of these characteristics towards fulfilling our organizational goals? For example, if we look at (A) for each of the Lifecycle stages of a product we can see that a typical life cycle starts at the NPI (New Product Introduction) stage. During this stage demand is highly undefined and stock-outs are a constant problem. Automated Forecasting is nearly impossible and S&OP is used for defining demand. Then, as the product moves into the Growth and Maturity Stages where volume increases and stabilizes. Forecasting, planning, and scheduling becomes routine and automated, requiring very little “hands on” support. Later, during the Decline and End of Life stages, the process becomes less automated and S&OP is used again. Margins are now pretty low and our biggest inventory concern is that we don’t want a lot of product obsolescence. We can see that in each of these stages the management of the demand and the corresponding planning and scheduling processes are quite different. “One size does not fit all.”
Moving on to the second prong of Return on Availability we focus on the various cost drivers (B) and their impact. What’s important here is an understanding of how the different drivers attack cost. We identify those drivers which have the largest impact based on your identified goals.
Finally, we look at the customer tiers (C). Here we recognize that all customers are not the same. For example, the Tier-1 customer may be the hospital or Sam’s club and the lower Tier customer may be the private residence or the small privately-owned game store. Each of these tiers require a different level of response.
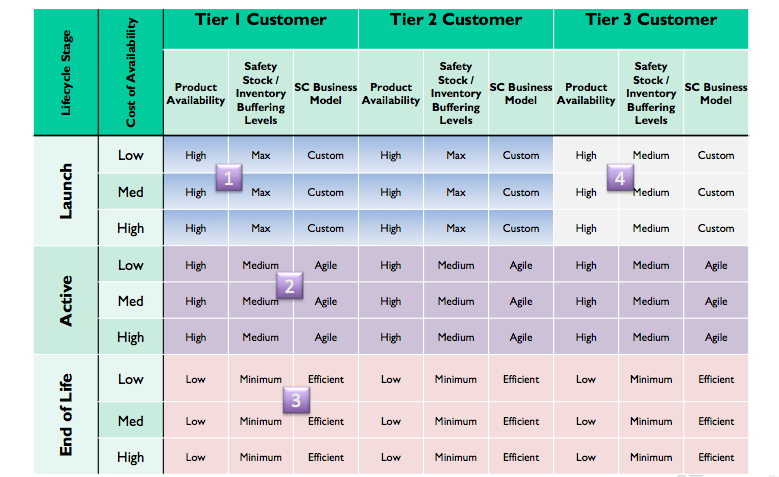
Once we have our Return on Availability defined, the next step is to take the three dimensions (Product life cycle, cost, and benefits) and map them out, defining the specific characteristics for each of the intersections of these three dimensions. This can been seen in the attached diagram. From this we can then create clusters of similar characteristics, and these clusters become our segments.
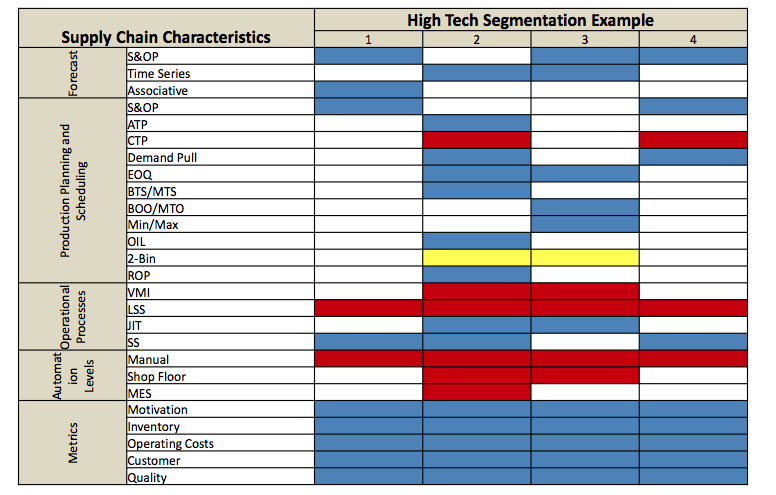
The next step in our segmentation exercise is to map each of the four defined segments by identifying the tool set that is needed in order optimize the performance of that segment. As you can see, each of the segments would utilize a different set of tools specifically focused on the needs of that segment. The blue boxes are tools that already exist within the organization, the yellow are tools that partially exist and which need full activation, and the red tools are tools that are missing and need to be brought into the organization.
Last, but not least in the segmentation process, is a look at the specific goals that are applied to each of the segments. This chart shows how the goals can be mapped into each segment. Performance for each segment will be different. End of life products won’t have the same types of inventory performance targets as mature products. The planning cadence of products in different segments won’t be the same. We may plan the mature products regularly based on the forecast, but the end of life products might be planned strictly on demand.
The most interesting aspect of this chart is the Touch level of the Planners. In the case of mature products, the automated systems are the most reliable and efficient. But in the case of the NPIs the planners tend to be heavily involved. The point is simply, this is not a one-size-fits-all scenario. Put your planning resources where they can have the most significant impact, which turns out not to be the products with the largest sales volume.

SUMMARY
Supply Chains are extremely complex, having inbound, internal, and outbound planning and scheduling complexities. Each of these has its own set of expectations and demands on planning and scheduling. Using a “one-size-fits-all” approach for any of these traps us into a false security, thinking that we can generalize our solution.
Segmentation allows us to customize specific solutions of clusters for products, or customers, or suppliers, based on their Return on Availability. Segmentation is the tool used for defining these optimal clusters which are constructed around a common set of characteristics. Then we can identify the optimal planning and scheduling tool set for each of these clusters.
Organizations who have applied segmentation had experienced enormous reductions in shipping costs, inventory costs, obsolescence costs, and stock outs while at the same time demonstrating dramatic increases in customer on-time deliveries. And what better reason is there for considering any solution to your supply chain management problems.
As soon as you start to experience the benefits of Supply Chain Segmentation done well, you will want to do this more regularly. Think of embedding the evaluation in your monthly S&OP cycle. Think of retuning allocations based on (expected) changes in demand or other circumstances on a weekly basis. In our next blog post, we will explore how you could support segmentation with the right process and optimization technology.
Get a roundup of our best supply chain content every month in your inbox! Sign up for our blog digest here.


